NRR (Net revenue retention)
Net revenue retention (NRR), also called net dollar retention (NDR), measures recurring revenue kept from the same customers, including upgrades, downgrades and cancellations.
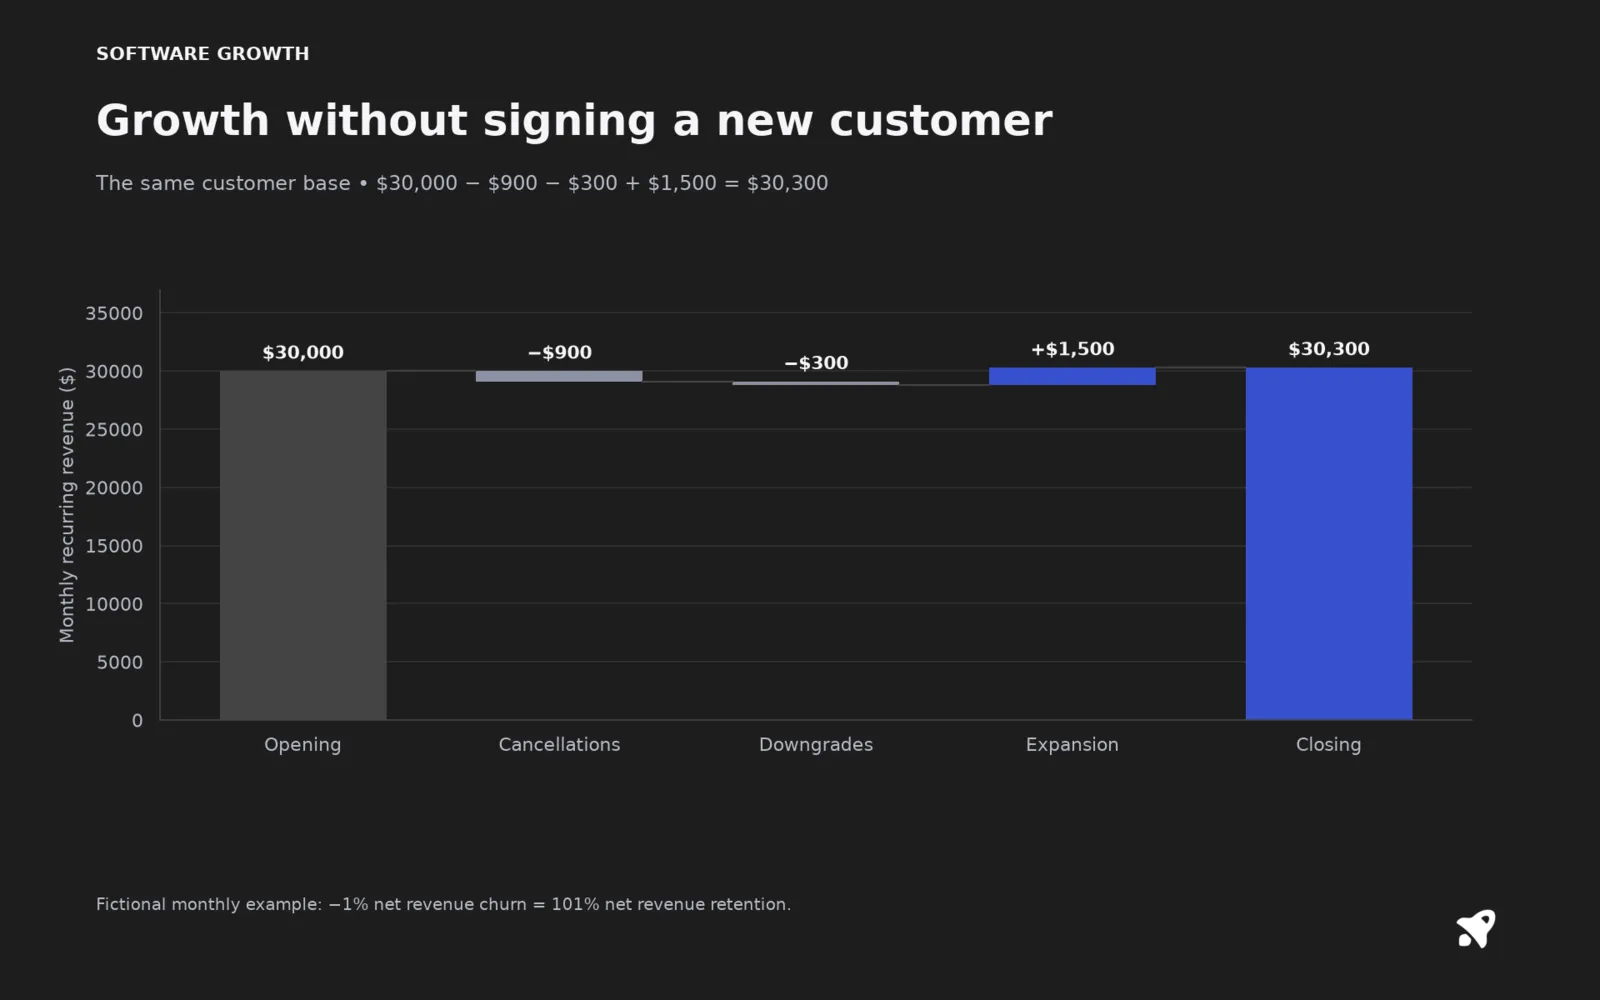
Net revenue retention (NRR) answers one question: if you stopped selling to new customers today, would your revenue grow or shrink? Take the customers you had a year ago, add up what they pay now, and compare it to what they paid then. Above 100% means your existing base grows on its own. Below 100% means you are refilling a bucket that leaks.
Net dollar retention (NDR), also called dollar-based net retention, is another name for this metric. Companies can use different calculation methods, so check their reporting definitions before comparing numbers.
How to calculate NRR
This is the same formula ChartMogul uses. Starting MRR is the MRR from customers who were active at the start of the period. New customers who joined during the period are left out completely.
Say your customers from twelve months ago paid $50,000 MRR. Since then, upgrades and extra seats added $9,000, downgrades removed $2,000, and cancellations removed $5,000.
Your older customers now pay $52,000. The base grew 4% with no new sales. Without the expansion, the same customers would sit at 86%, which is your gross revenue retention.
What good looks like
Benchmarks depend heavily on who you sell to. Lenny Rachitsky's retention benchmark study gives these 12-month NRR targets as good and great:
- Consumer SaaS: 55% and 80%
- Bottom-up SaaS: 100% and 120%
- Land and expand, very small business: 80% and 100%
- Land and expand, SMB and mid-market: 90% and 110%
- Enterprise SaaS: 110% and 130%
For public companies, Dave Kellogg's benchmark slides put the median at 111%, and 104% across a broader set. Jason Cohen notes in Max MRR that NRR at IPO tends to be well above 100%, and gives 119% as a typical figure.
Common mistakes
- Including new customers. That turns NRR into a growth number.
- Using too short a window. Monthly NRR is noisy and hides renewal cycles, which is why most teams report on 12 months.
- Reading one big number. A single large account expanding can hide widespread churn, so always look at gross retention next to it.
- Mixing definitions between snapshot and period revenue methods. The reporting methods below explain how public companies calculate retention.
Which name is used where
- NRR is the common label in subscription analytics tools and in startup writing. ChartMogul, for example, publishes its net and gross revenue retention definitions under that name.
- NDR is the label you tend to see from investors and finance people. Dave Kellogg's benchmark slides use it, and report a public company median of 111%.
- Dollar-based net retention and similar phrases show up in S-1 and 10-K filings, where each company defines the term in its own footnotes.
The basic formula
If customers who paid you $40,000 MRR a year ago pay $45,000 today, NDR is 112.5%. New customers are excluded from both sides.
Cohort method versus snapshot method
The formula leaves room for two approaches, and they give different numbers.
- Snapshot (MRR) method. Compare MRR on one date with MRR on the same date a year earlier for the same customers. This is what the example above does.
- Cohort (period revenue) method. Compare revenue over a full period, such as twelve months, with revenue from the same customers over the prior period. Snowflake describes its version in its annual report: it takes customers using the platform in the first month of a two-year window, and divides their product revenue in the second year by their revenue in the first. A customer that stopped using the product stays in the calculation with zero revenue.
Say a cohort generated $400,000 of revenue in year one and $460,000 in year two. The cohort method gives 460 / 400 = 115%. The snapshot method on the same customers could give a different figure, because it measures a single month at the end rather than the average across the year, and a fast-growing cohort looks better on the snapshot.
Reading a reported number
- Check the footnote for the method, the window and which customers are included.
- Usage-based companies are more volatile, since revenue moves with consumption and not contracts.
- Companies may adjust for acquisitions, as Snowflake does, which changes comparability.
- Compare numbers only when the definitions match.
For small SaaS
Pick one method, write it down, and keep it. A snapshot MRR version computed from your billing data every quarter is fine. The value is in the trend and in splitting it by cohort, not in matching a public company's footnote.
For small and bootstrapped SaaS
NRR above 100% needs expansion revenue, which flat-rate pricing does not produce. If you charge one price per account, your NRR cannot exceed 100% and your goal is simply to keep it as close to 100% as you can. Adding a value metric, such as seats or usage, is what makes negative churn possible.
Related terms
Sources
- Net and Gross Revenue Retention, ChartMogul
- What is good retention?, Lenny Rachitsky, Lenny's Newsletter
- Pulse 2021 Slides: Net Dollar Retention (NDR) Benchmarks and Thoughts, Dave Kellogg, Kellblog
- Max MRR: Your Growth Ceiling, Jason Cohen, A Smart Bear
- Snowflake Inc. Form 10-K, fiscal year 2025, Snowflake Inc., SEC