MRR (Monthly recurring revenue)
MRR is the predictable revenue your subscriptions produce each month, with annual and quarterly plans converted to a monthly amount and one-time fees left out.
MRR (monthly recurring revenue) is the predictable subscription revenue your business brings in each month. To calculate it, convert every active paying subscription to its monthly amount and add them up, leaving out one-time fees.
MRR is the number most subscription founders check first each morning. It tells you how much recurring revenue your product is producing right now. Unlike cash in the bank or accounting revenue, it is not distorted by who paid annually or when an invoice happened to land. Baremetrics describes it as all of your recurring revenue normalized into a monthly amount, and warns that it should not be used as an accounting figure. That distinction matters later.
How to calculate MRR
Convert every active paying subscription to its monthly equivalent, then add them up.
ChartMogul's MRR guide puts the rule for a single subscription simply: the amount paid divided by the number of months in the billing interval. An annual plan is divided by 12, a quarterly plan by 3.
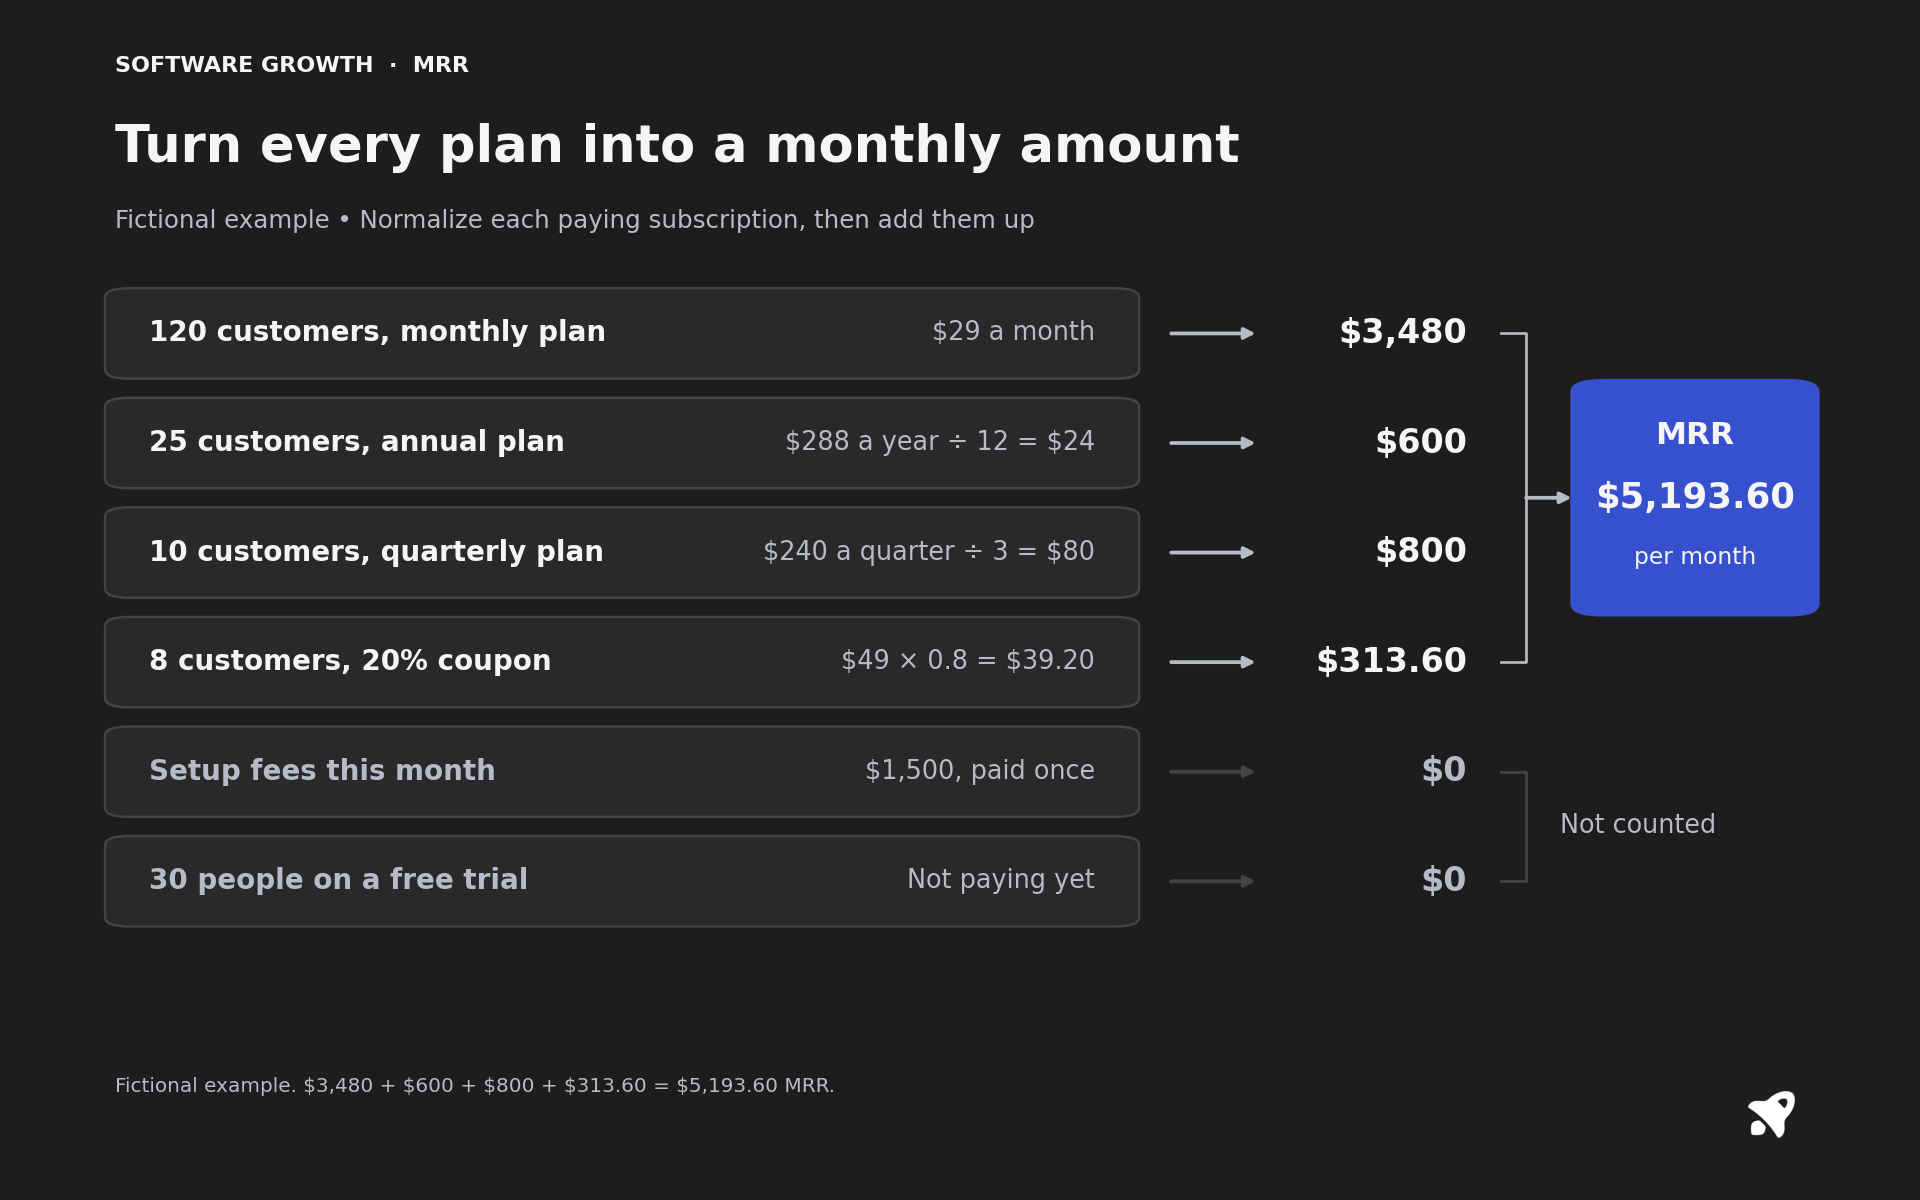
A smaller example: you have 100 customers on a $29 monthly plan and 20 customers on a $348 annual plan. The monthly customers add $2,900. Each annual customer is $348 / 12 = $29 per month, so those add $580. Your MRR is $3,480.
The shortcut version is customers multiplied by average revenue per account, but summing real subscriptions is more accurate once your plans differ.
What counts and what doesn't
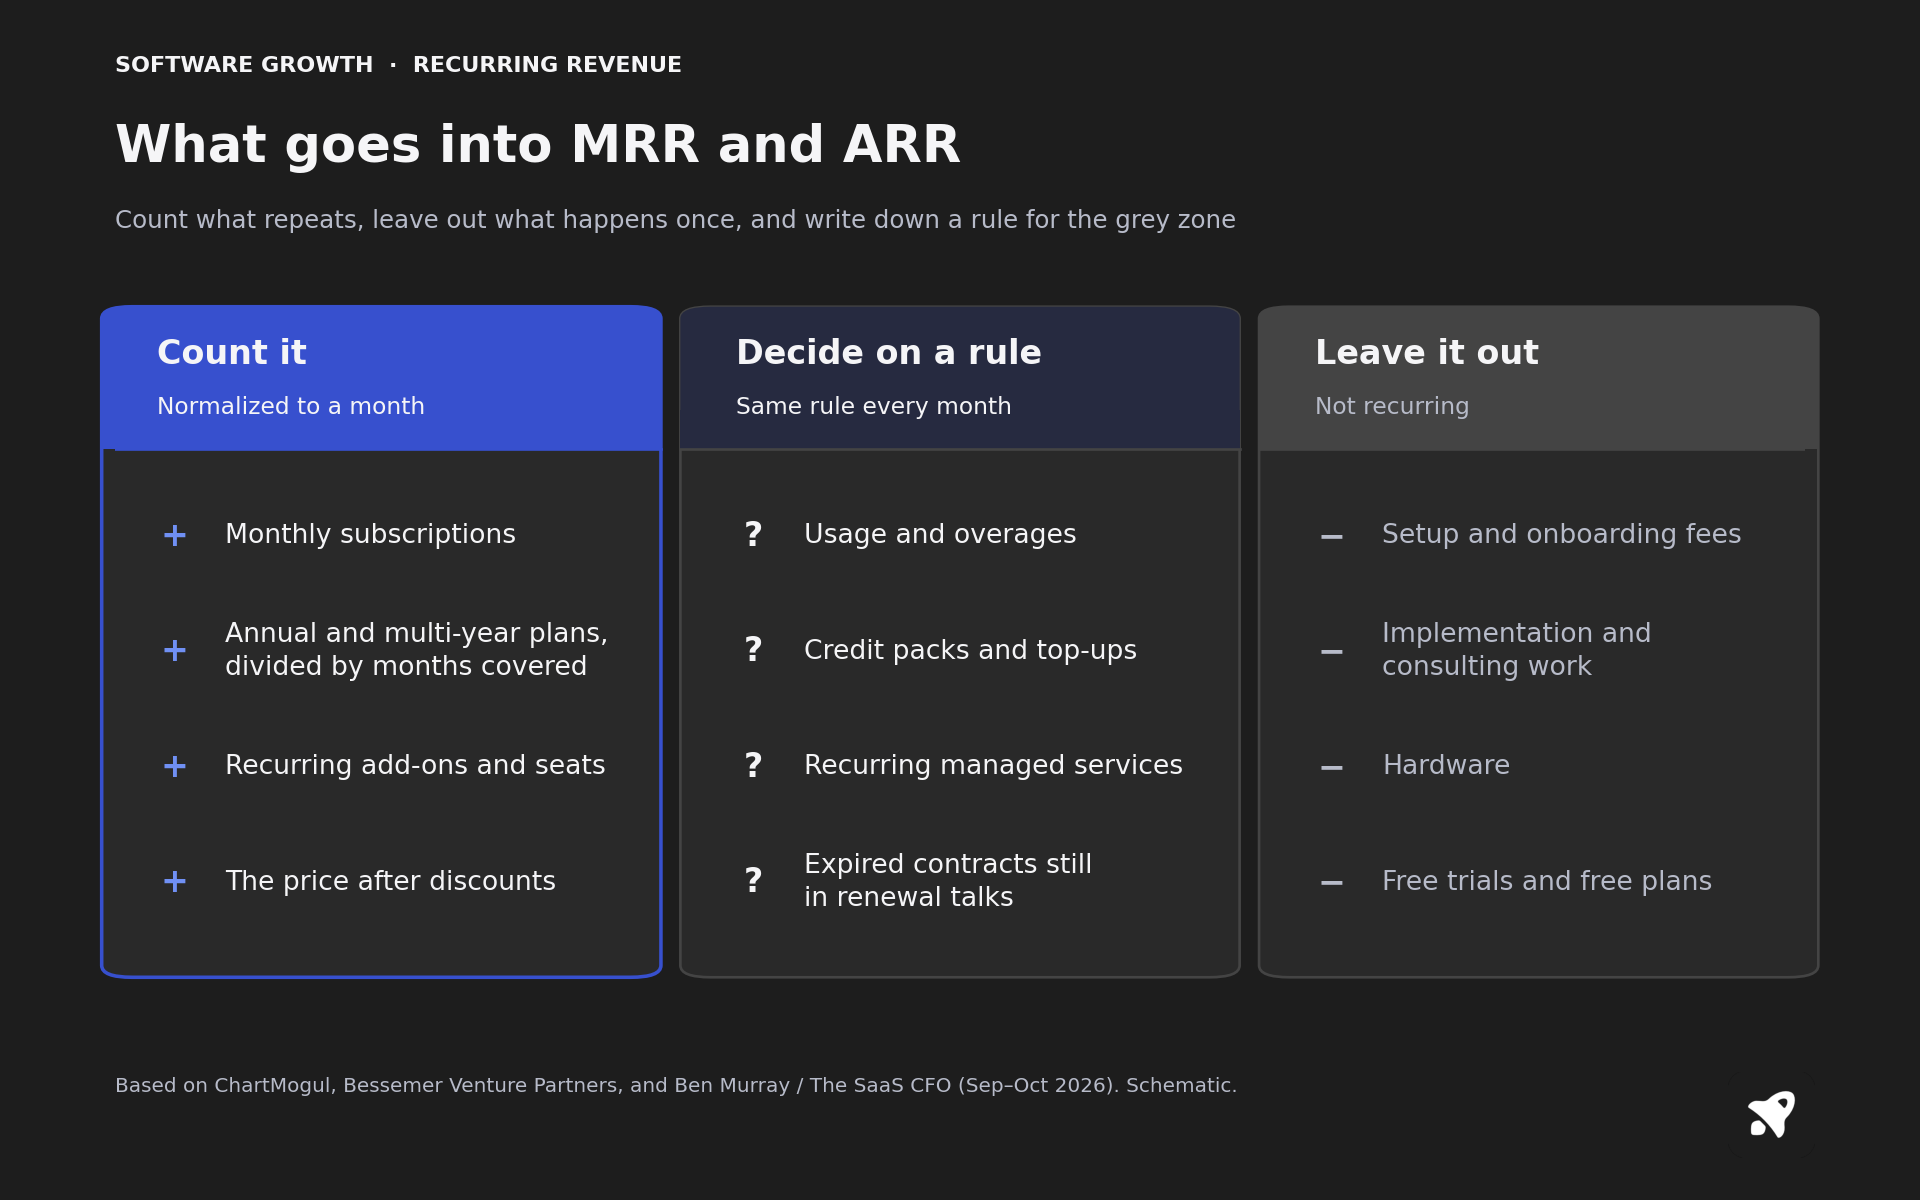
- One-time fees. Setup, onboarding, migration and consulting are not recurring. ChartMogul's guide is explicit: any one-time charge or fee should be excluded.
- Annual payments left unnormalized. A $1,200 annual payment is $100 of MRR, not $1,200 in the month it arrives. Counting the full amount makes MRR spike in renewal months and look like growth. ChartMogul calls this a common mistake.
- Trials and free users. Only paying customers count. A trial that has not converted is a lead.
- Discounts you have not netted out. Use what the customer actually pays after coupons.
- Usage, overages and credits that swing. Decide on a rule, such as a trailing three-month average, and apply it every month.
Credits are the newest version of that last problem. Elena Verna, who works at Lovable, wrote on October 16, 2026 that AI products increasingly price in credits, tokens and other units instead of dollars; Lovable's $25 a month plan includes 100 credits. The $25 subscription is MRR. Extra credit packs bought on top behave like usage, so they belong under whatever written rule you use for overages.
The MRR movements
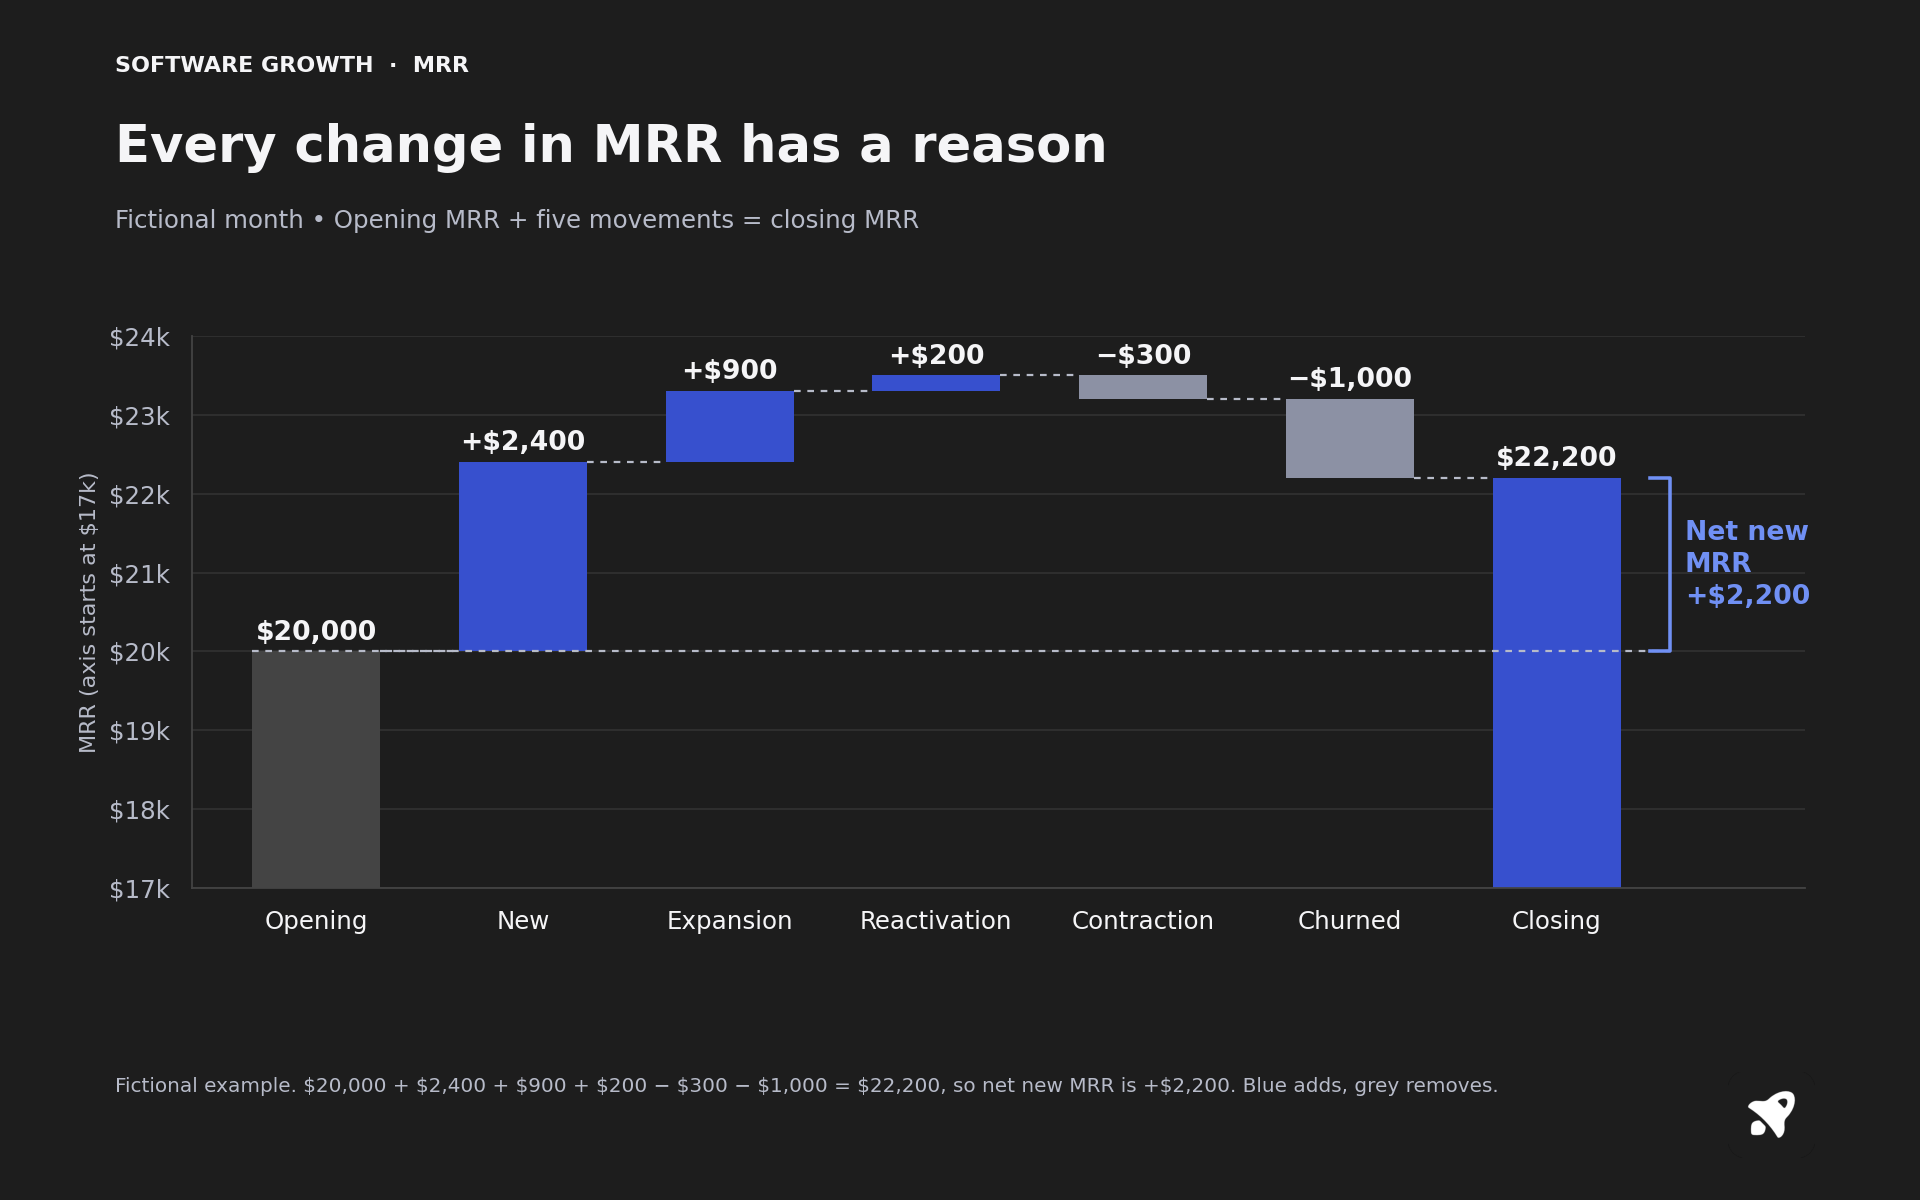
MRR changes for five reasons. ChartMogul's documentation uses the same categories, plus a sixth, neutral movement, for changes that don't move MRR, such as switching between two plans with the same price. David Skok recommends tracking the components separately rather than watching only the total.
- New MRR: a first-time customer starts paying. See new MRR.
- Expansion MRR: an existing customer pays more through upgrades, seats or add-ons. See expansion MRR.
- Contraction MRR: an existing customer pays less but stays. See contraction MRR.
- Churned MRR: a customer cancels their last subscription. See churned MRR.
- Reactivation MRR: a past customer comes back. See reactivation MRR.
The movements matter because the same total can hide very different businesses. Jason Cohen shows that while Buffer's MRR stagnated and then shrank, it was getting more new customers and upgrades than ever before, and even more cancellations and downgrades.
Worked example
Formbird is a fictional bootstrapped form builder. It starts the month at $20,000 MRR. During the month it adds $2,400 of new MRR, $900 of expansion and $200 of reactivation, and loses $300 to contraction and $1,000 to churn.
- Closing MRR: 20,000 + 2,400 + 900 + 200 − 300 − 1,000 = $22,200
- Net new MRR: 22,200 − 20,000 = $2,200
- MRR growth rate: 2,200 ÷ 20,000 = 11% for the month
- Revenue lost to cancellations: 1,000 ÷ 20,000 = 5% of opening MRR
- ARR: 22,200 × 12 = $266,400
One more number is worth computing, using the method in the next section. If Formbird keeps adding $2,400 of new MRR a month and keeps losing 5% to churn, ignoring the smaller movements, its MRR will level off around 2,400 ÷ 0.05 = $48,000, no matter how long it waits.
Churn sets a ceiling on MRR
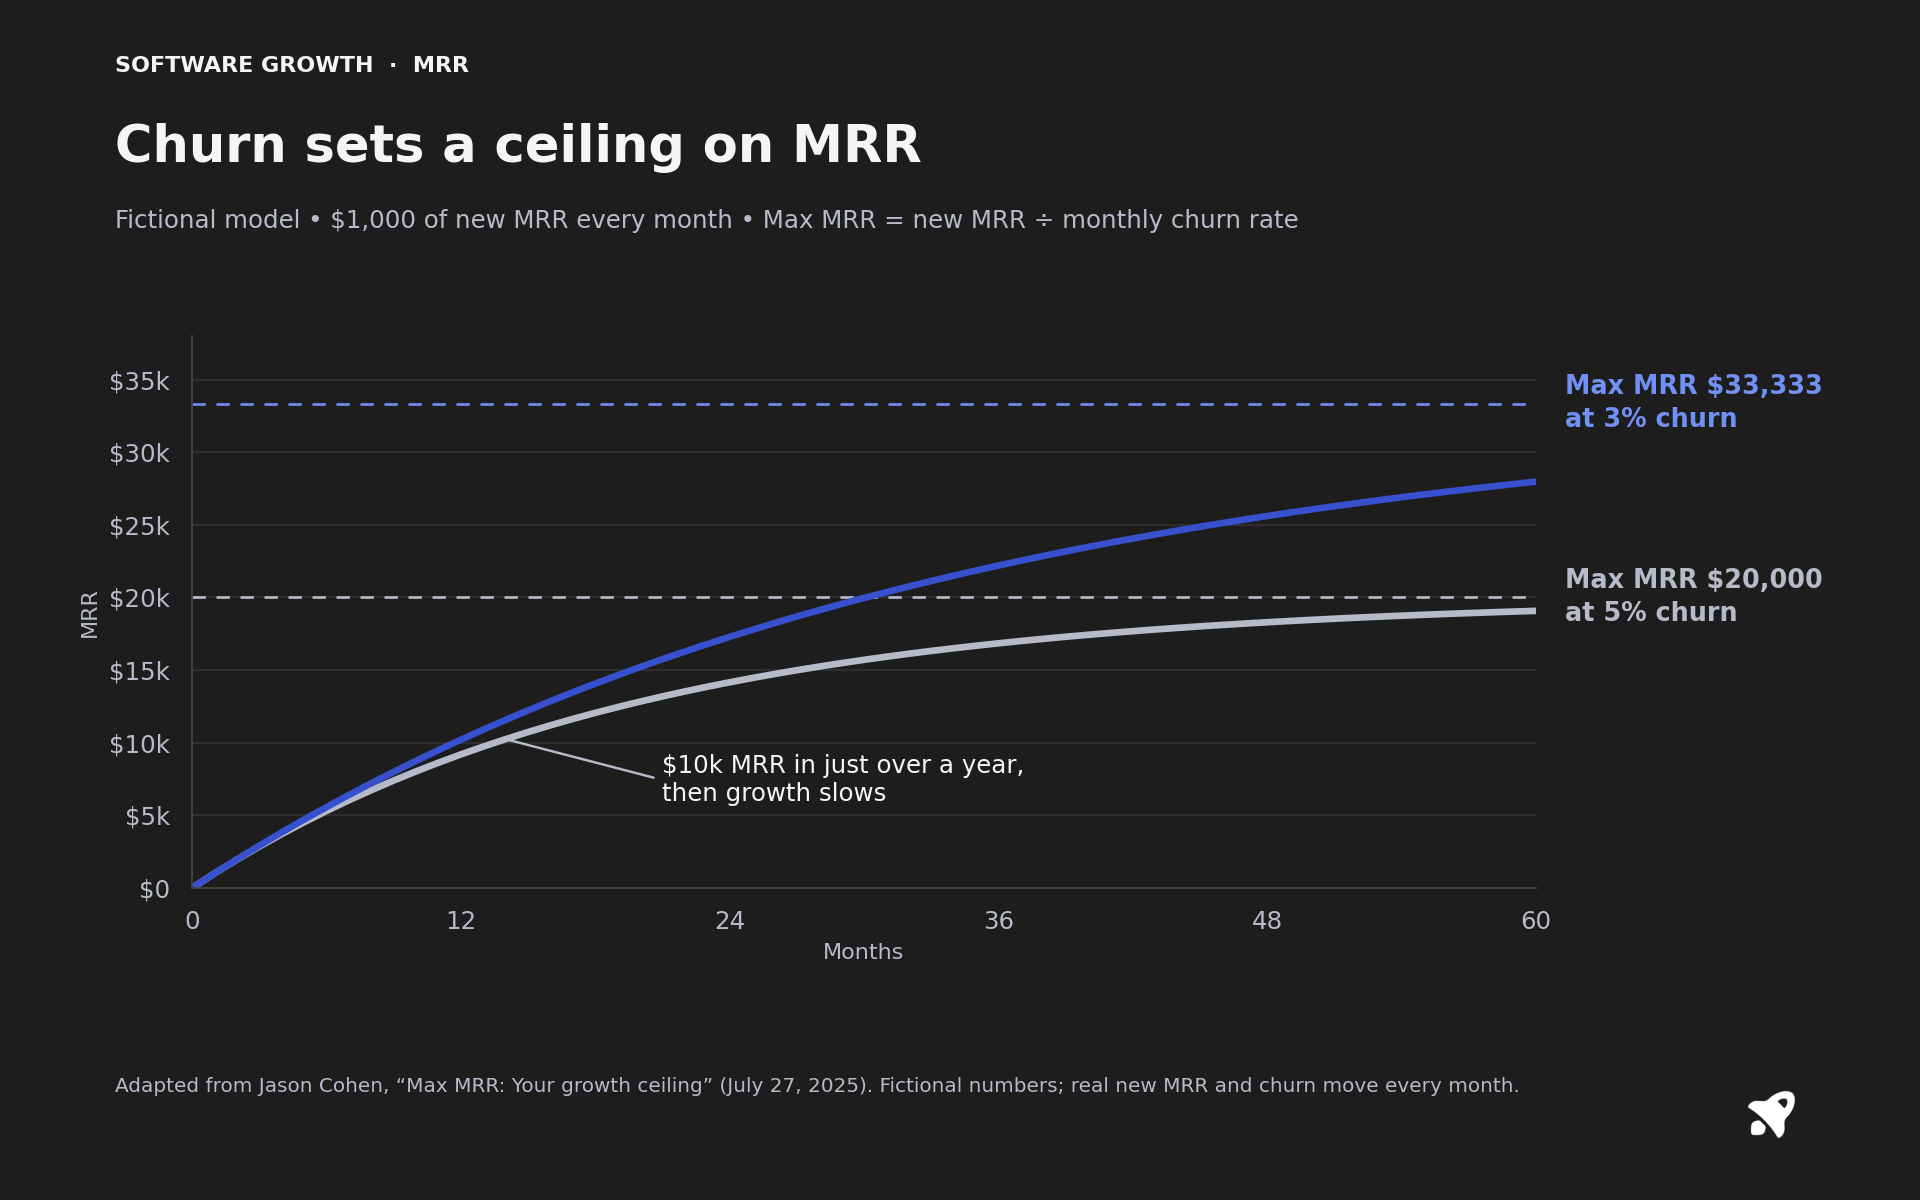
New MRR tends to arrive at a steady pace, but churn grows with the size of the business: 5% of $20,000 is twice as many dollars as 5% of $10,000. Eventually the dollars lost each month equal the dollars added, and MRR stops growing. Jason Cohen calls that level Max MRR: new MRR per month divided by the monthly cancellation rate. In his example, $1,000 of new MRR a month at 5% churn tops out at $20,000.
Your company will stop growing sooner than you think.
Jason Cohen / Max MRR: Your growth ceiling (July 27, 2025)

Cohen's argument is that Max MRR is a leading indicator. Current MRR reacts slowly when you cut churn, but the ceiling jumps immediately, so it tells you months ahead whether a change is working. It also explains a common pattern: fast early growth that slows long before the market runs out, because the churn from existing customers has caught up with new sales.
MRR is not revenue
MRR is a run rate. Accounting revenue is recognized as service is delivered (see revenue recognition), so the two can differ in any given month, especially with refunds, proration or annual prepay. Cash differs again: an annual plan paid up front puts twelve months of cash in the bank in one month while adding only one month's worth to MRR. Use MRR to steer the business and your accountant's numbers for taxes and reporting.
Benchmarks for bootstrapped SaaS
Rob Walling treats MRR as the first metric to watch and month-over-month growth as the second.
MRR shows where you are.
Rob Walling / Startups for the Rest of Us, episode 620 (September 6, 2022)

Benchmarks worth knowing, from sources that study smaller companies:
- Look at absolute dollars added, not just the percentage. Walling points out that adding a steady $5,000 a month makes the percentage growth rate fall as you grow, and for a mostly bootstrapped founder that is still an excellent business. Dollars are what you can spend on hiring.
- Monthly churn: in the same episode, Walling calls 2% monthly churn amazing for a bootstrapped SaaS, 3% good, 4% fine and 5% not great. At 7 to 8% and above, he says, the business is on fire. Use Max MRR above to see what your rate implies.
- The usual road to $10,000 MRR is about 100 customers at about $100 a month. That was the path for 53% of 1,043 companies in Kyle Poyar's analysis of ChartMogul data (June 3, 2026). Higher prices bought better retention: median annualized gross revenue retention at $10,000 MRR was 70.5% for companies charging $300 to $2,999 a month per account, against 31.6% for those charging $30 to $299.
- Price decides the sales channel. In a MicroConf talk, John Ndege describes a rule of thumb: under about $300 a month per customer you rely on content marketing, and above it you can afford salespeople. His product, Pocket Risk, sat at $230 MRR after a year and 46 demos, then grew to about $10,000 MRR once he committed to talking to one customer every day.
What changed recently
Three pieces from September and October 2026 are worth knowing about:
- Expansion MRR comes early. Kyle Poyar's study of 10.5 million purchases across 4,029 software companies (September 30, 2026) found that seat upgrades peak in a customer's first month at 0.83% and fall to 0.09% by month 11. Plan upgrades follow the same curve, except that 40% of first-year plan upgrades happen at the month-12 annual renewal.
- Reactivation MRR is bigger than you'd guess. In the same data, more than 5% of churned customers came back within three months, and nearly 10% for AI-native products. Poyar's advice is to keep a cancelled customer's workspace, data and settings so returning takes one click. See win-back campaign.
- Credits complicate the definition. Verna's October 16 post (above) shows how far AI pricing has moved from plain seats. If a growing share of your revenue is credit top-ups, write down how you treat them before the number gets big.
Customers are up to 10x more persuadable in the first 30 days
Kyle Poyar / The 30-day upsell window (September 30, 2026)
MicroConf also published John Ndege's talk on September 21, 2026. It was recorded at MicroConf US 2023, so treat it as an established playbook rather than new data.
Common mistakes
- Booking an annual payment as one month of MRR.
- Counting setup fees, services or trial users.
- Watching only total MRR, so heavy churn hides behind strong new sales.
- Reporting only percentage growth, which falls naturally as MRR grows, instead of dollars added.
- Changing the definition, for example starting to count usage, without restating earlier months.
Where it matters for a small SaaS
Under about $1M in recurring revenue, MRR is also the better working number than ARR because it reacts to a month of good or bad work instead of hiding it inside a yearly figure.
Pick one definition, write it down, and keep it stable. A metric you quietly redefine every quarter is worse than a slightly imperfect one you apply consistently.
Listen, watch and read next
- Read: Max MRR: Your growth ceiling, Jason Cohen (July 27, 2025). The full argument, with Buffer's public MRR as a case study.
- Listen: Startups for the Rest of Us, episode 620, Rob Walling (September 6, 2022). The metrics he would pick first, and his churn benchmarks for bootstrappers.
- Watch: How One Daily Habit Took MRR From $230 to $10K, John Ndege at MicroConf (published September 21, 2026). The $300 a month rule is at 10:35.
- Read: The 30-day upsell window, Kyle Poyar (September 30, 2026). When expansion and reactivation MRR actually happen, with tactics for each.
- Read: Startups become what they hunt, Kyle Poyar (June 3, 2026). How your price point on the way to $10,000 MRR shapes retention for years.
- Watch: SaaS Metrics: The BEST Guide to Software as a Service KPIs, Rob Walling (March 9, 2022). A 14-minute tour of the metrics around MRR.
Related terms
- ARR (Annual recurring revenue)
- New MRR
- Expansion MRR
- Churned MRR
- Net new MRR
- MRR growth rate
- Recurring revenue
Sources
- What is MRR, Baremetrics
- Monthly Recurring Revenue (MRR), ChartMogul, updated September 8, 2026
- Understanding MRR movements, ChartMogul
- SaaS Metrics 2.0, David Skok, For Entrepreneurs
- Episode 620: Finding SaaS ideas, customer pain, SaaS metrics and more, Startups for the Rest of Us, September 6, 2022
- Max MRR: Your growth ceiling, Jason Cohen, A Smart Bear, July 27, 2025
- Startups become what they hunt, Kyle Poyar, Growth Unhinged, June 3, 2026
- The 30-day upsell window, Kyle Poyar, Growth Unhinged, September 30, 2026
- What on earth is going on with AI pricing and packaging?, Elena Verna, October 16, 2026
- B2B SaaS Sales: How One Daily Habit Took MRR From $230 to $10K, John Ndege, MicroConf (recorded 2023, published September 21, 2026)